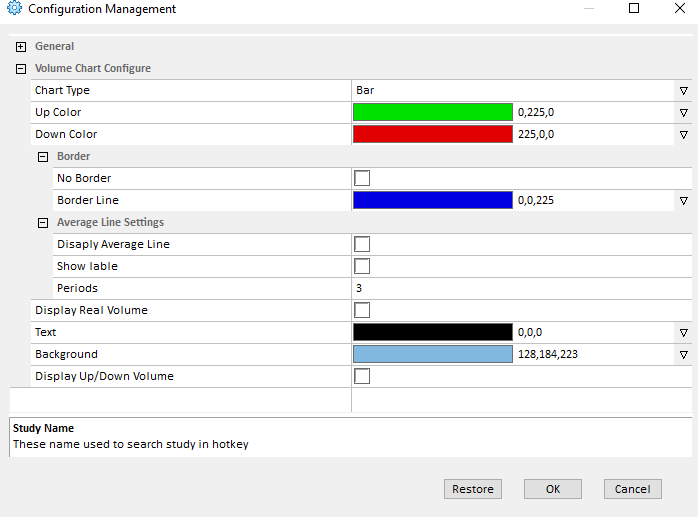
The Volume study allows the trader to see the stock’s traded volume in real time. The trader can add this study to their chart by right clicking the chart and selecting Study Config to open the study configure window first, then select the “Volume” from the Available Studies list and add it into the Current Studies list.

Explanation of Each Field
Chart Type: The user can use the drop down menu to change the chart type:
- Bar: Select this to use the bar chart.
- Line: Select this to use the Line chart.
- Area: Select this to use the Area chart.
Color section allows the user to modify the colors of the volume chart:
- Up Color: This color represents the price up volume in the bar chart.
- Down Color: This color represents the price down volume in the bar chart.
- No Border: Allows the user to enable and disable the bar chart’s border.
- Border Line: This represents the border line’s color in Bar Chart, it also represents the line’s color for Line Chart and area’s color for Area Chart.
Average Line Settings: Allows the user to also add a volume average line to the chart.
- Display Average Line: Allows the user to enable and disable the volume average line in the chart.
- Show Label: Allows the user to add a label to the y-axis, which displays the latest average volume in the study period.
- Periods: Enter the periods for the average line.
Display Real Volume: Allows the user to add a label to the y-axis, which displays the real volume. The user can also change the label’s text color and background color by clicking on the text color field and the background color field.
Display Up/Down Volume: Check the box to separate the volume bar by price up and price down. (Note: this is only for the bar chart.)


