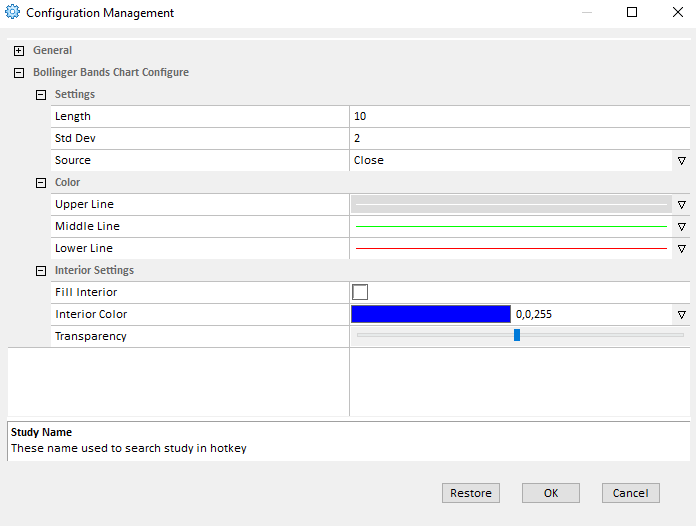
The user can add the Bollinger Bands indicator to their chart by right clicking the chart and selecting Study Config to open the study configure window first, then select the “Bollinger Bands” study from the Available Studies list and add it into the Current Studies list.

Explanation of Each Field
Settings section: Allows the user to modify some study parameters for the Bollinger Bands study.
- Length: Enter the study period/length for the Bollinger Bands study.
- Std Dev: Enter the period for the standard deviation.
- Source: The user can use the drop down menu to change the study source for the Bollinger Bands study.
- Open: Use the open price data to calculate the Bollinger Bands.
- High: Use the highest price data to calculate the Bollinger Bands.
- Low: Use the lowest price data to calculate the Bollinger Bands.
- Close: Use the close price data to calculate the Bollinger Bands.
- (High+Low)/2: Use this equation to calculate the price first, then use those price data to calculate the Bollinger Bands.
- (High+Low+Close)/3: Use this equation to calculate the price first, then use those price data to calculate the Bollinger Bands.
- (Open+High+Low+Close)/4: Use this equation to calculate the price first, then use those price data to calculate the Bollinger Bands.
Note: Open, High, Low, and Close represent each bar’s open price, highest price, lowest price and close price.
Color section: Allows the user to modify the associate field’s line style, line color, and line width.
Interior Settings: Allows the user to fill the space between the bands as well as set the color and transparency of the fill.


