
The user can add the Pivot Point indicator to their chart by right clicking the chart and selecting Study Config to open the study configure window first, then select the “PivotPoint” study from the Available Studies list and add it into the Current Studies list.
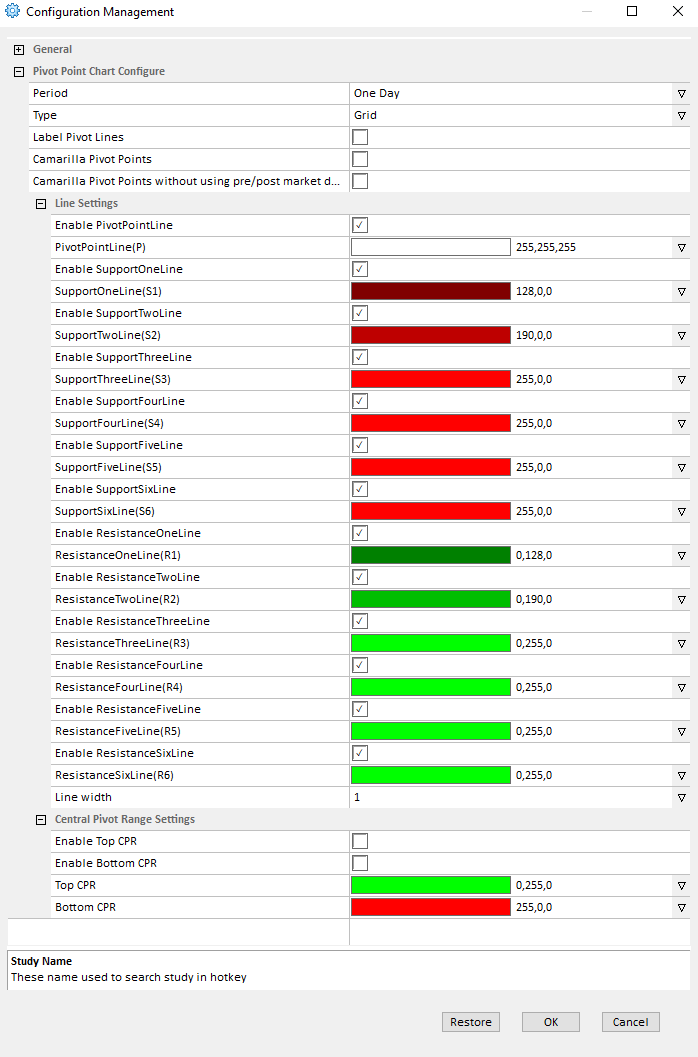
Explanation of Each Field
Period: Allows user to adjust the study period for Pivot Point Study. (The numbers represent the number of bars).
Type: Allows the user to change the chart type.
- Line: Select this to use the line chart.
- Grid: Select this to use the grid chart.
Label Pivot Lines: Check this box to add labels to the pivot lines.
Camarilla Pivot Points: Check this box to use the Camarilla pivot point.
Camarilla Pivot Points without using pre/post market data: Check this box to use the Camarilla pivot point, but exclude pre and post market data.
Line Settings: Adjust the line colors as well as enable or disable each Pivot line.
Central Pivot Point Settings: Allows the user to enable the top or bottom CPR as well as change the line colors.


