What is the Post-Market Scanner?
The Post-Market scanner is a volume scanner that calculates the total trading volume during the post-market session for each stock in real time and compares it with the Historical Average Post-Market Volume for the past 05/10/30/60 days. If the current post-market volume is higher than the historical average post-market volume, the Trade Signal message will be generated by the Post-Market scanner and be visible in the results screen for the Post-Market scan.
- Scanner Category: Volume
- Scanner ID: 3
- Scanner Type: Customizable, which means the threshold values of the filters can be changed.
- The scanner working time is from 16:00:00 to 20:00:00.
- The current Post-Market Volume: calculates the trading volumes from the start time of the Post-Market session to the current time, for example:
- If the current time is 18:11:23: The current Post-Market Volume = calculated trading volumes from 16:00:00 to 18:11:23.
- If the current time is 19:00:00: The current Post-Market Volume = calculated trading volumes from 16:00:00 to 19:00:00.
- If the current time is 19:59:59: The current Post-Market Volume = calculated trading volumes from 16:00:00 to 19:59:59.
- The Historical Average Post-Market Volume: The Total Post-Market Volume on average for the past 05/10/30/60 trading days, for example:
- 05-day Historical Average Post-Market Volume = (Sum [ last 05 post-market volume]) / 05
- 10-day Historical Average Post-Market Volume = (Sum [ last 10 post-market volume]) / 10
- 30-day Historical Average Post-Market Volume = (Sum [ last 30 post-market volume]) / 30
- 60-day Historical Average Post-Market Volume = (Sum [ last 60 post-market volume]) / 60
Trigger Conditions
The Post-Market scanner will be triggered if all of the following conditions are true:
- The current Post-Market Volume is higher than the Historical Average Post-Market Volume.
- All of the common filters are true.
Create a new Subscription for the PostMarket Scanner
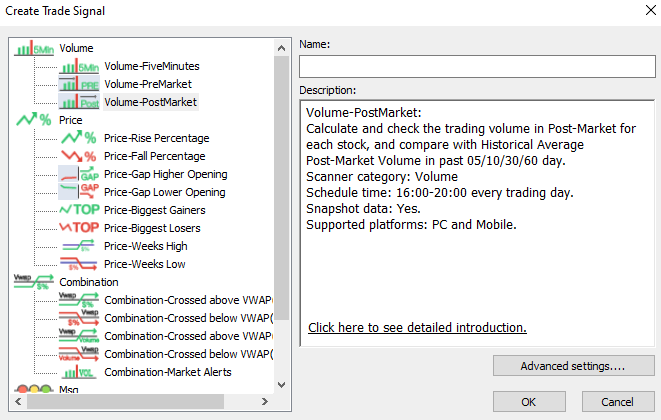
In the Create Trade Signal window, choose ‘Volume-PostMarket’ and click the OK button. A new subscription will be created.
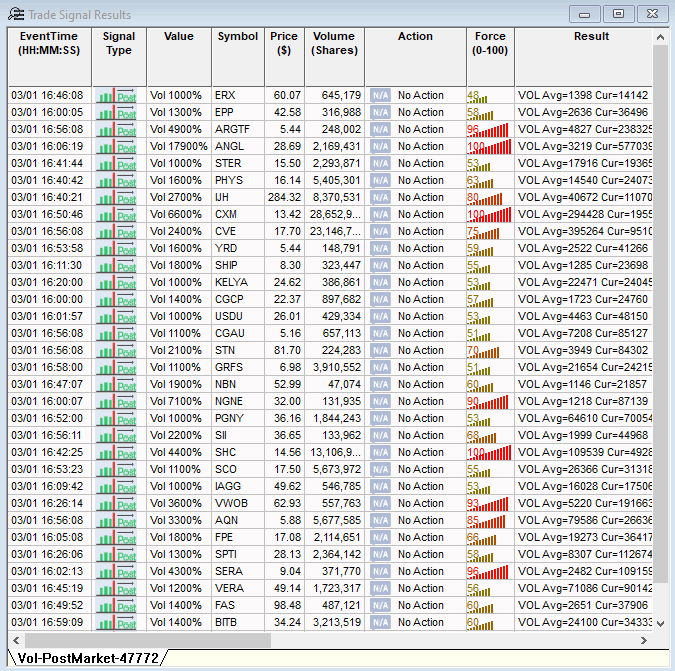
After adding the Vol-PostMarket scanner, it will appear in the main Trade Signal List window. Double click on the name of the scan in the Trade Signal List window and the Trade Signal Results screen will be visible. By default, the Voume-PostMarket scan is already pre-configured and results should be visible in this window after opening it.
Update the Filters of the Post-Market Scanner
There are several Optional Filters that can be adjusted for each Trade Signal scan. Please review these Optional Filters here: https://dastrader.com/docs/optional-filters/. The settings mentioned below fall under the Mandatory Filters section in the TradeSignal Config window.
Vol-Historical Volume Type
This setting defines a type of historical average post-market volume to compare with the current post-market volume.
Value Range
- 05-day historical average
- 10-day historical average
- 30-day historical average
- 60-day historical average
Formula: Historical Average Post-Market Volume = ((Sum [ last X post-market volumes]) / X) Note: X value is 05/10/30/60 days.
For example: 10-Day Average Volume will compare the current Post-Market Volume with the 10-day historical average Post-Market Volume.
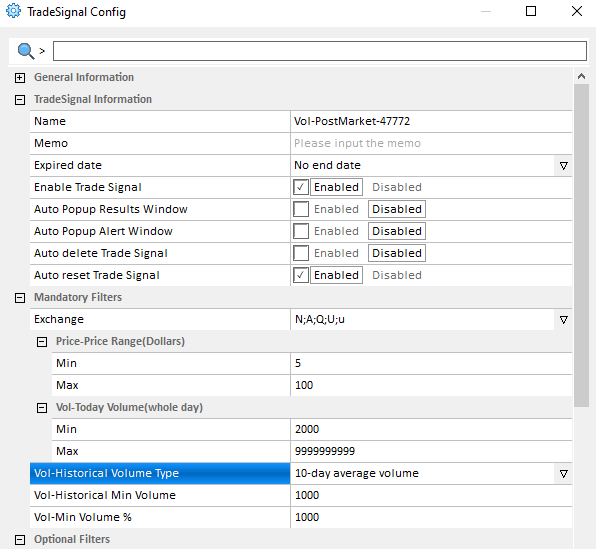
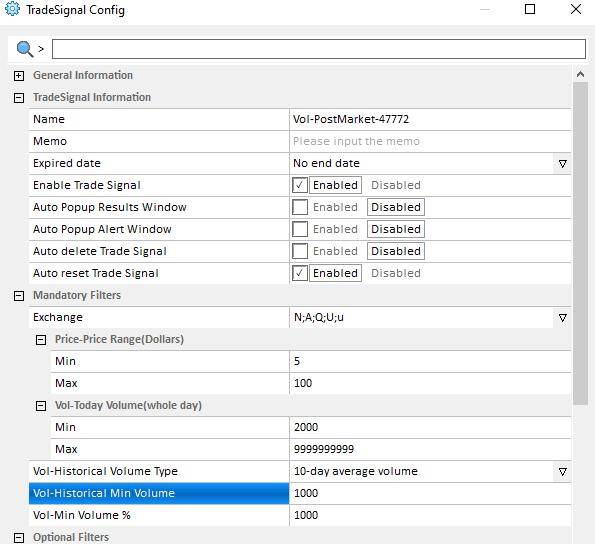
Vol-Historical Min Volume
This setting defines the minimum of historical average post-market volume to filter. Stocks where the historical average volume is at least the specified number of shares.
Value Range: 5-99999999
Formula: if (Historical Average Post-Market Volume >= Min Historical Volume). Note: Historical Average Post-Market Volume = ((Sum [last X post-market volumes]) / X) where X is 05/10/30/60 days and set by the Vol-Historical Volume Type setting above.
For example: 1000 means Historical Average Post-Market Volume is higher than or equal to 1000.
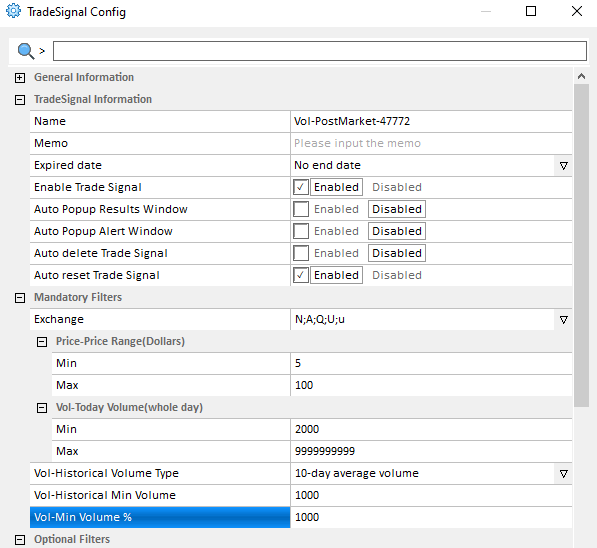
Vol-Min Volume %
This setting defines the threshold value for triggering alarm messages. Stocks where the Volume is at least a specified percentage of Historical Average Volume will trigger the alarm.
Value Range: 200-99999
Formula: (Current Post-Market Volume / Historical Average Post-Market Volume)*100%
Historical Average Post-Market Volume = ((Sum [last X post-market Volumes]) / X. Note: The value of X is 05/10/30/60 days and is set by the filter Vol-Historical Volume Type setting above.
For example: 1000 means the Current Post-Market Volume is 10 times higher than the Historical Average Post-Market Volume.
Example of a Customized Post-Market Scanner
Open TradeSignal from the Tools > TradeSignal menu. When the TradeSignal List window opens, click the New button. In the window that opens, select Volume-PostMarket under the Volume scanner options. Click the Advanced Settings button and set the following options:
- Mandatory Filters:
- Exchange: N;A;Q;U;u (this is already configured by default)
- Price-Price Range (Dollars): Min: 5, Max: 1000
- Vol-Today Volume(whole day): Min: 50000, Max: 9999999999
- Vol-Historical Volume Type: 30-day average volume
- Vol-Historical Min Volume (shares): 1000
- Vol-Min Volume %: 1000
- Optional Filters:
- Vol-Avg Daily Volume(30Day): Enabled; Min: 200000, Max: 9999999999
- Vol-Avg Daily Volume(30Day): Enabled; Min: 200000, Max: 9999999999
- Price-Volatility %(30Day): Enabled; Min: 0, Max: 15
- Price-Volatility %(60Day): Enabled; Min: 0, Max: 15
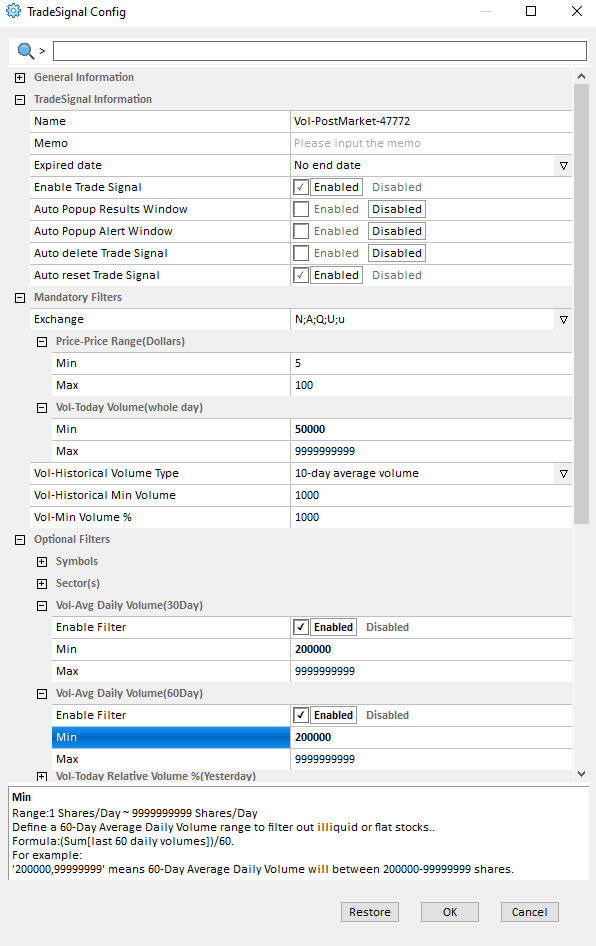
Click OK and the TradeSignal scan will be saved. Double click on the name of the scan in the TradeSignal List window to view the results.
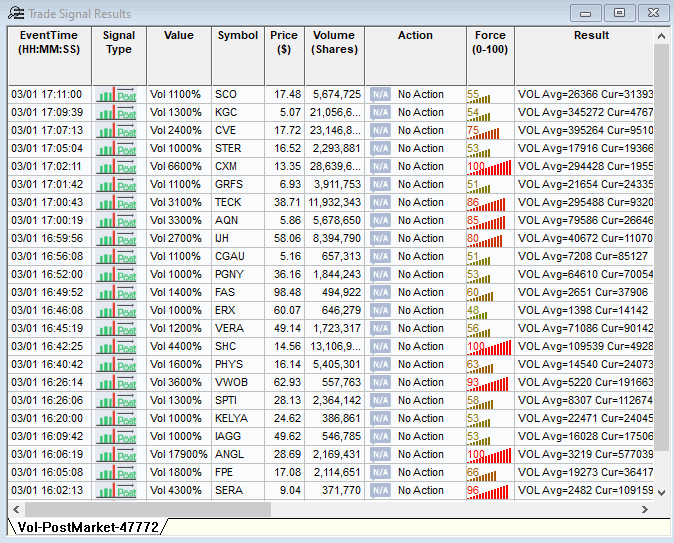
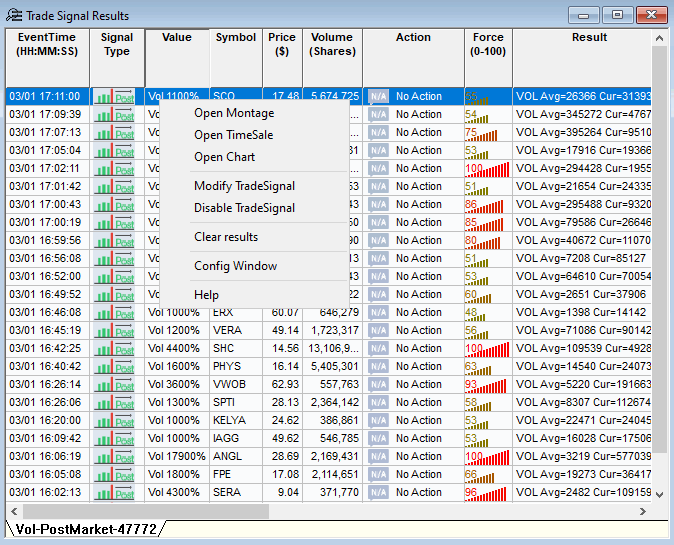
Right click on any result and you will be able to open a montage, chart or time and sale window.
