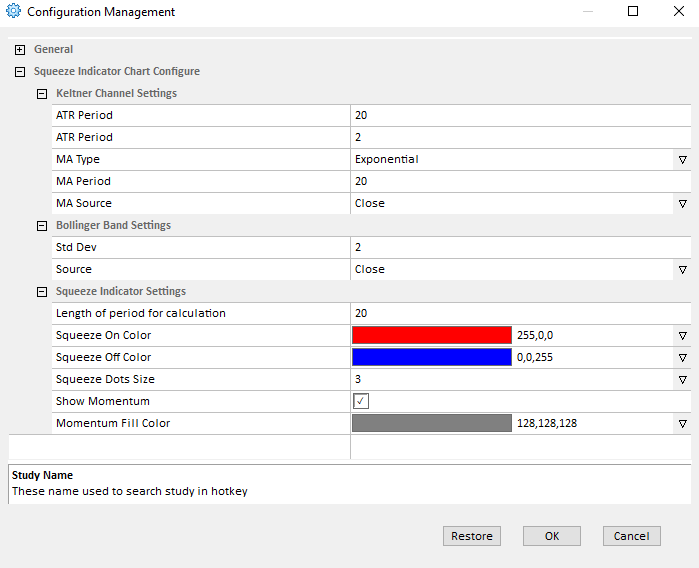
The user can add the Squeeze indicator to their chart by right clicking the chart and selecting Study Config to open the study configure window first, then select the “Squeeze” study from the Available Studies list and add it into the Current Studies list.

Explanation of Each Field
Keltner Channel Settings: Allows the user to adjust the settings related to the Keltner Channel:
- ATR Period: Allows the user to adjust the Average True Range Period of the Squeeze study.
- ATR Period: Allows the user to adjust the Average True Range Period of the Squeeze study.
- MA Type: Select the type of moving average used for the study.
- MA Period: Enter the study period for the exponential moving average.
- MA Source: Use the drop down menu to select the study source for the exponential moving average.
- Open: Use the open price data to calculate the exponential moving average.
- High: Use the highest price data to calculate the exponential moving average.
- Low: Use the lowest price data to calculate the exponential moving average.
- Close: Use the close price data to calculate the exponential moving average.
- (High+Low)/2: Use this equation to calculate the price first, then use those price data to calculate the exponential moving average.
- (High+Low+Close)/3: Use this equation to calculate the price first, then use those price data to calculate the exponential moving average.
- (Open+High+Low+Close)/4: Use this equation to calculate the price first, then use those price data to calculate the exponential moving average.
Bollinger Band Settings: Allows the user to modify some study parameters for the Bollinger Bands.
- Std Dev: Enter the period for the standard deviation.
- Source: The user can use the drop down menu to change the study source for the Bollinger Bands study.
- Open: Use the open price data to calculate the Bollinger Bands.
- High: Use the highest price data to calculate the Bollinger Bands.
- Low: Use the lowest price data to calculate the Bollinger Bands.
- Close: Use the close price data to calculate the Bollinger Bands.
- (High+Low)/2: Use this equation to calculate the price first, then use those price data to calculate the Bollinger Bands.
- (High+Low+Close)/3: Use this equation to calculate the price first, then use those price data to calculate the Bollinger Bands.
- (Open+High+Low+Close)/4: Use this equation to calculate the price first, then use those price data to calculate the Bollinger Bands.
Note: Open, High, Low, and Close represent each bar’s open price, highest price, lowest price and close price.
Squeeze Indicator Settings: Allows the user to adjust the squeeze study settings.
- Length of period for calculation: Adjust the period used for the calculation of the squeeze.
- Squeeze on color: Click the color to change the color of the line used for the squeeze on.
- Squeeze off color: Click the color to change the color of the line used for the squeeze off.
- Squeeze dots size: Adjust the size of the dots visible for the squeeze.
- Show Momentum: Tick the box to show the momentum.
- Momentum Fill Color: Click the color to change the color used for the momentum.


