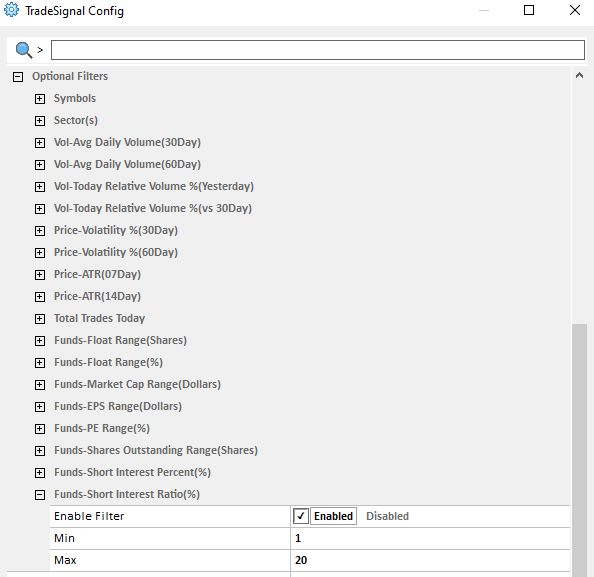
The Trade Signal Config window offers many optional filters that the user can adjust to their needs for the various scans that are available. Below is a description of each type of filter.
Symbols
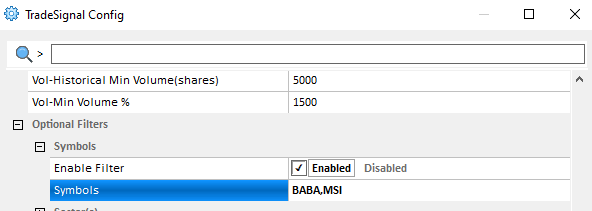
Set one or more symbols that should be scanned, separated by a comma for more than one symbol. These will be the only symbols included in the scan. Be sure to tick the ‘enabled’ box to enable this setting.
Sectors
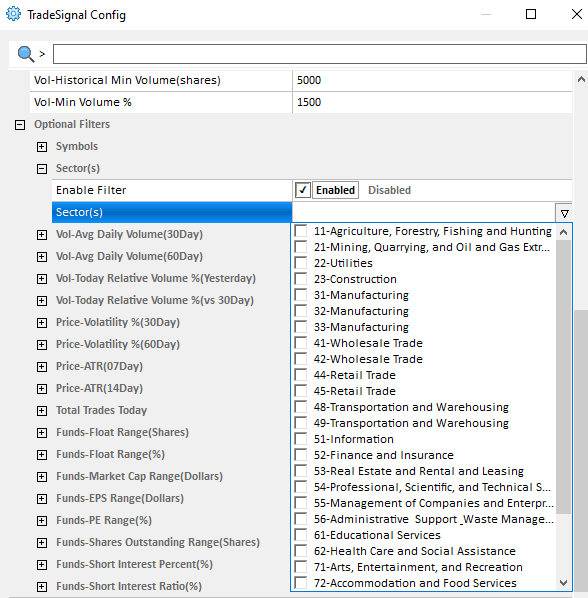
Select from a drop down a list of various sectors to be included in the scan. Note that only symbols that match the criteria of the selected sector will be included in scans. Be sure to tick the ‘enabled’ box to enable this setting.
Vol-Avg Daily Volume (30Day)
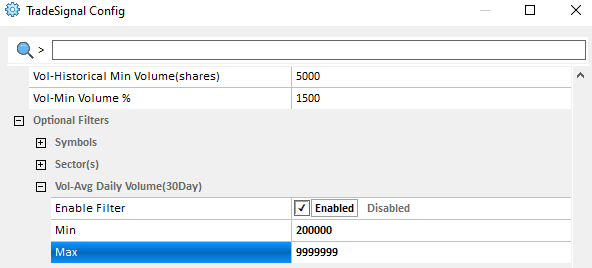
Define a 30-day average Daily Volume range to filter out illiquid or flat stocks.
Formula: (sum[last 30 day volume]/30)
For example: Min: 200000, Max: 9999999 means scan for symbols where the 30-day Average Daily Volume falls between 200000 and 9999999 shares traded.
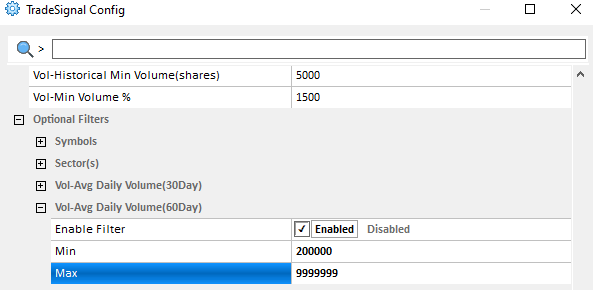
Vol-Avg Daily Volume (60Day)
Define a 60-day average Daily Volume range to filter out illiquid or flat stocks.
Formula: (sum[last 60 day volume]/60)
For example: Min: 200000, Max: 9999999 means scan for symbols where the 60-day Average Daily Volume falls between 200000 and 9999999 shares traded.
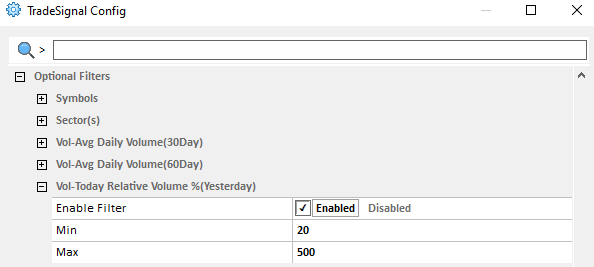
Vol-Today Relative Volume %(Yesterday)
Today’s volume vs. yesterdays volume based on percentage.
Formula: (today’s volume/yesterday’s volume)*100%)
For example: Min: 20, Max: 500 means scan for symbols where the percentage of volume traded between yesterday and today falls between 20% and 500%.
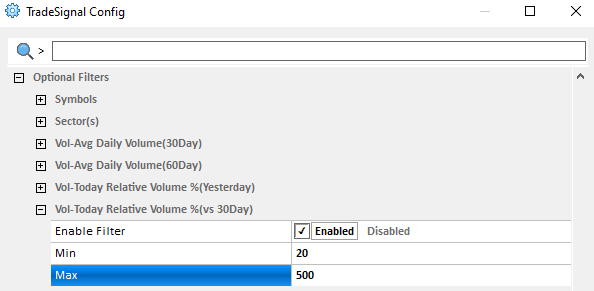
Vol-Today Relative Volume %(vs 30Day)
Today’s volume vs. 30-Day Average Daily volume percentage.
Formula: (today’s volume/30-day average daily volume)*100%)
For example: Min: 20, Max: 500 means scan for symbols where the percentage of volume traded between today and the 30-day average daily volume percentage falls between 20% and 500%.
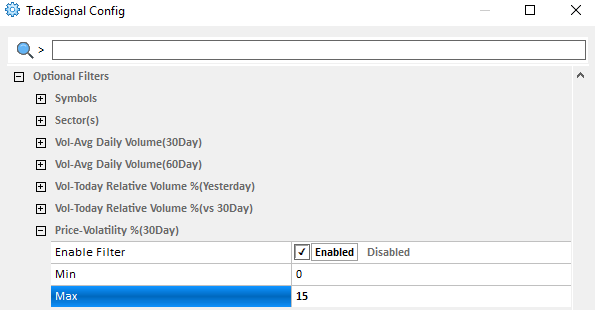
Price-Volatility %(30Day)
Define a range of 30-Day Average Price Volatility to filter.
Formula: (sum[last 30 daily true range)/(sum[last 30 daily close price])*100%
For example: Min: 0, Max: 15 means scan for symbols where the 30-day average daily volatility will fall between 0% and 15%.
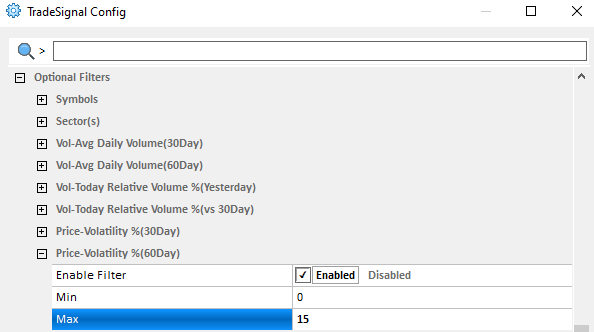
Price-Volatility %(60Day)
Define a range of 60-Day Average Price Volatility to filter.
Formula: (sum[last 60 daily true range)/(sum[last 60 daily close price])*100%
For example: Min: 0, Max: 15 means scan for symbols where the 30-day average daily volatility will fall between 0% and 15%.
Price-ATR(07Day)
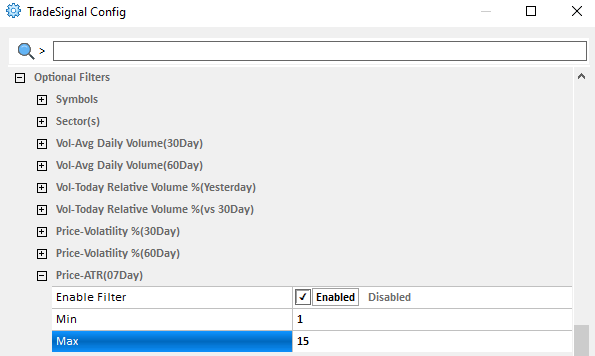
Define a range of 07-Day ATR (Average True Range) to filter.
Formula: ATR=(sum[last 07 daily true range])/7
For example: Min: 1, Max: 15 means scan for symbols where the 7 day Average True Range is between 1 and 15.
Price-ATR(14Day)
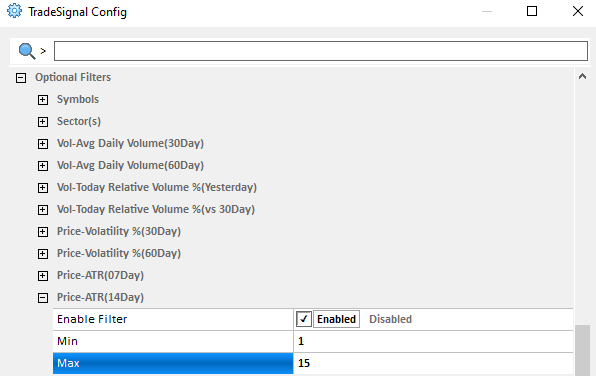
Define a range of 14-Day ATR (Average True Range) to filter.
Formula: ATR=(sum[last 14 daily true range])/14
For example: Min: 1, Max: 15 means scan for symbols where the 14 day Average True Range is between 1 and 15.
Total Trades Today
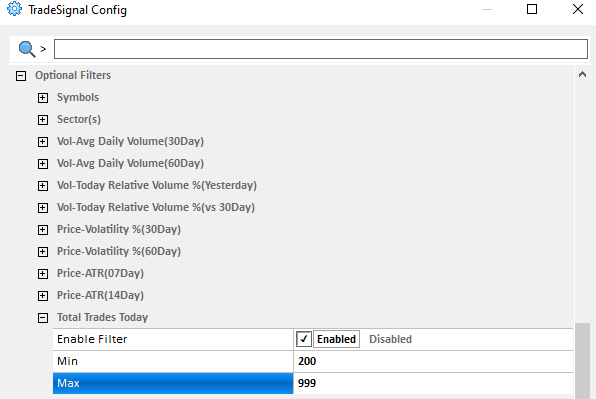
The total number of trades for the day.
For example: Min: 200, Max: 999 means to scan and filter symbols where the total number of trades ranged from 200 to 999.
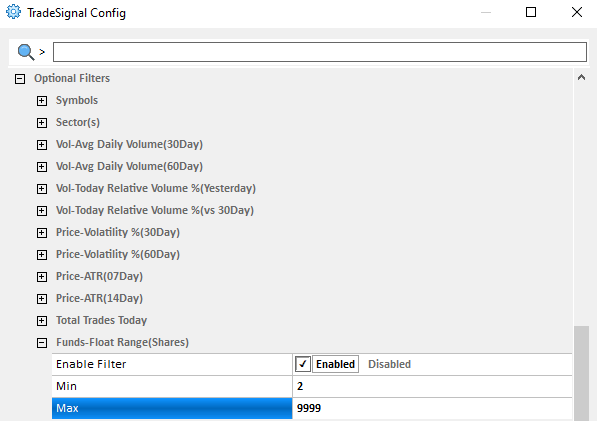
Funds-Float Range(Shares)
Define a range of number of available shares for the symbols scanned.
For example: Min: 2, Max: 9999 will only show symbols where the outstanding number of shares available is between 2 and 9999.
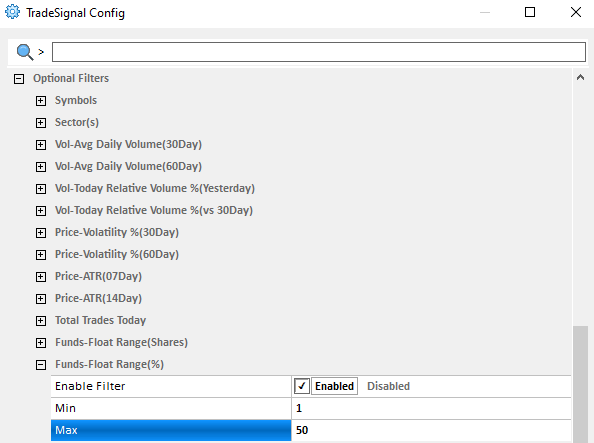
Funds-Float Range(%)
Define a range of number of available shares based on percentage for the symbols scanned.
For example: Min: 2, Max: 9999 will only show symbols where the outstanding number of shares available is between 1% and 50%.
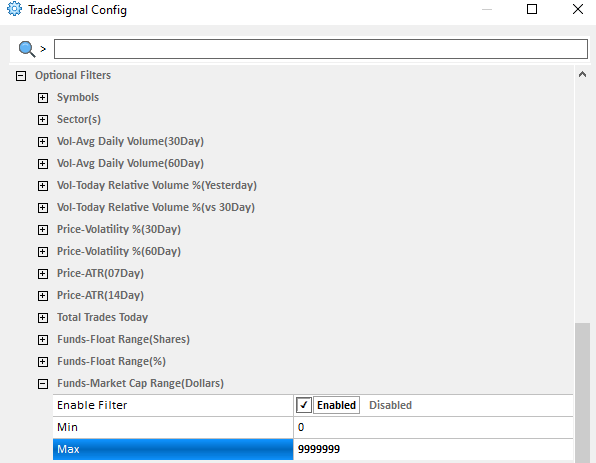
Funds-Market Cap Range(Dollars)
Define a range of market capitalization based on dollar amount for the symbols scanned.
Formula: (shr outstd*lastPrice)
For example: Min: 2, Max: 9999999 will only show symbols where the market capitalization is between $2 and $9999999.
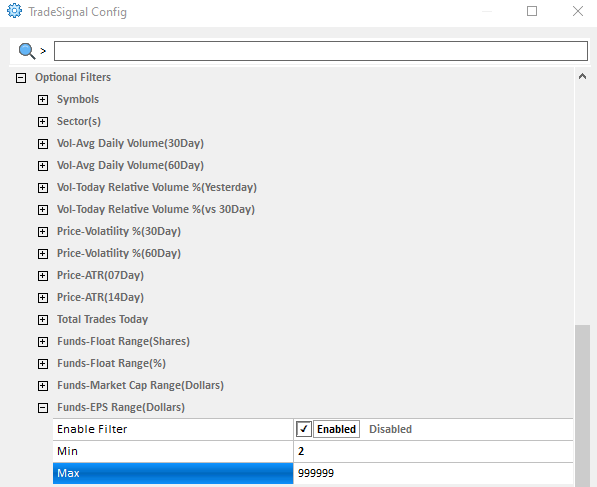
Funds-EPS Range(Dollars)
Define a range based on the EPS (Earnings Per Share) of a company’s profit allocated to each outstanding share for the symbols scanned.
For example: Min: 2, Max: 9999999 will only show symbols where the Earnings Per Share is between $2 and $9999999.
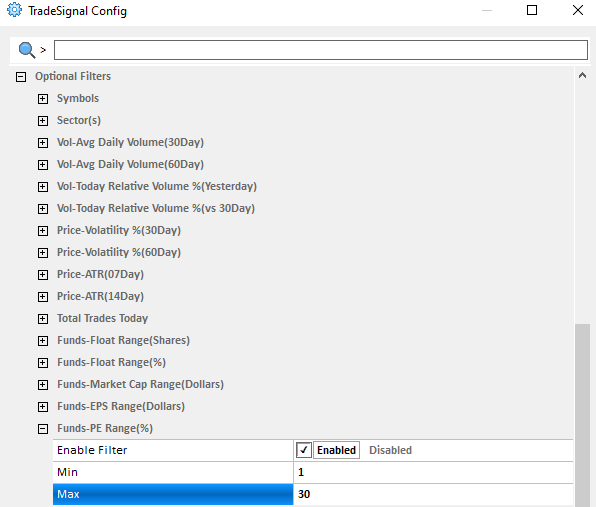
Funds-PE Range(%)
Define a range based on the Price/Earnings Per Share ratio for the symbols scanned.
For example: Min: 1, Max: 30 will only show symbols where the Price/Earnings Per Share ratio is between 1 and 30.
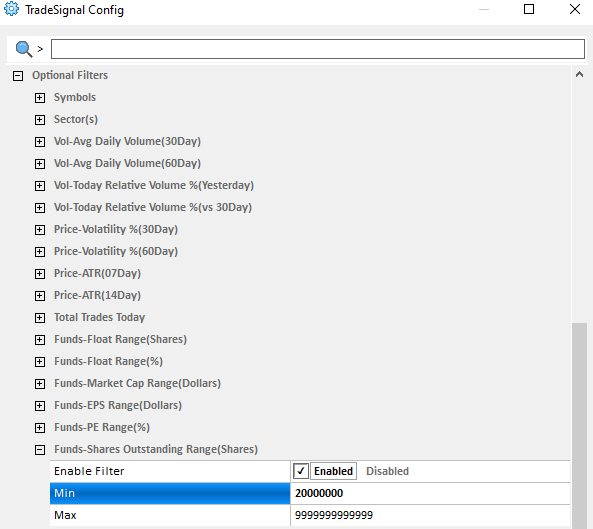
Funds-Shares Outstanding Range(Shares)
Define the number of common shares outstanding for the symbols scanned.
For example: Min: 20000000, Max: 9999999999999 will only show symbols where the common shares outstanding is between 20000000 and 9999999999999.
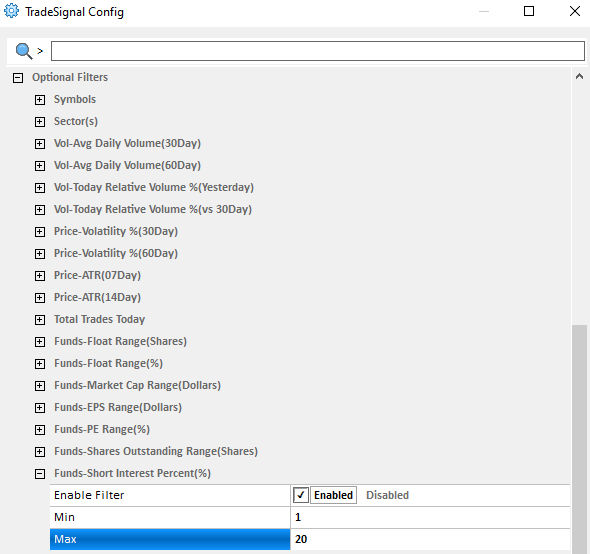
Funds-Short Interest Rate Percent (%)
Define the Short Interest percent for the symbols scanned. Short interest is the number of shares sold short but not yet covered and shares outstanding is the amount of common shares outstanding.
Formula: Short Interest/Shares Outstanding*100
For example: Min: 1, Max: 20 will only show symbols where the short interest percent is between 1% and 20%.
Funds-Short Interest Rate Ratio(%)
Define the Short Interest percent for the symbols scanned. Short interest is the number of shares sold short but not yet covered.
Formula: Short Interest/Avg Daily Volume (30Day)*100%
For example: Min: 1, Max: 20 will only show symbols where the short interest ratio is between 1% and 20%.
