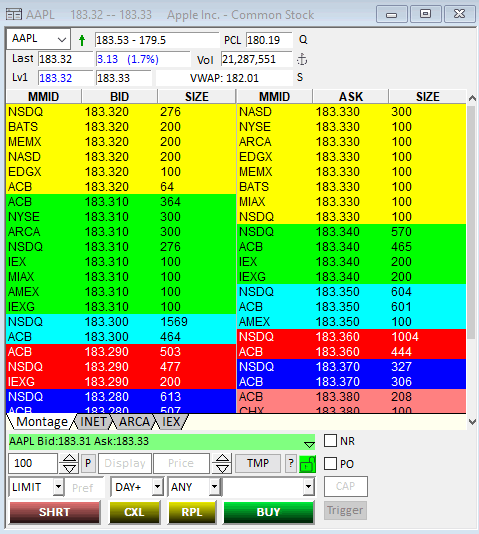
Market depth is a term that refers to the amount of liquidity or trading activity in a particular market. Market depth can be measured by looking at the order book, which shows the bids and offers for specific security at different price levels. The order book can be divided into two types of market data: Level 1 and Level 2.
Level 1 market data provides basic information about the current prices and volumes of a security. Level 1 market data includes the following information:
- Bid price: The highest price that a buyer is willing to pay for a security
- Bid size: The number of shares, contracts, or lots that buyers are willing to buy at the bid price
- Ask price: The lowest price that a seller is willing to accept for a security
- Ask size: The number of shares, contracts, or lots that sellers are willing to sell at the asking price
- Last price: The price at which the most recent trade occurred
- Last size: The number of shares, contracts, or lots that were traded at the last price
Level 1 market data is useful for chart-based trading systems and strategies that rely on price action or technical indicators. However, Level 1 market data does not show the full picture of the market, as it only shows the best bid and ask prices and sizes.
Level 2 market data provides more information than Level 1 market data by showing multiple levels of bids and offers for security. Level 2 market data includes the following information:
- Highest bid prices: The top five to 15 prices where buyers are willing to buy a security and have placed an order to do so
- Bid sizes: The number of shares, contracts, or lots that buyers are willing to buy at each bid price level
- Lowest ask prices: The top five to 15 prices where sellers are willing to sell a security and have placed an order to do so
- Ask sizes: The number of shares, contracts, or lots that sellers are willing to sell at each ask price level
Level 2 market data is also known as “market depth” by showing the supply and demand for a security at different price levels. Level 2 market data provides traders with a more complete picture of the market, allowing them to make more informed decisions.
How can Level 2 market data help an investor make better trading decisions in the US stock markets?
Level 2 market data can help an investor make better trading decisions in the US stock markets by providing several advantages, such as:
- Identifying support and resistance levels: Support and resistance levels are price points where the demand and supply of security tend to balance out, creating barriers for further price movement. By looking at Level 2 market data, traders can see where there are large clusters of bids and offer at certain price levels, indicating potential support and resistance levels.
- Assessing market sentiment: Market sentiment refers to the overall attitude of traders towards a security or a market. By looking at Level 2 market data, traders can see whether there are more buyers or sellers in the market, as well as how aggressive they are in placing their orders. For example, if there are more bids than asks at higher price levels, it may indicate bullish sentiment, whereas if there are more asks than bids at lower price levels, it may indicate bearish sentiment.
- Spotting trading opportunities: By looking at Level 2 market data, traders can spot trading opportunities based on various factors, such as price movements, volume changes, order imbalances, order cancellations, order executions, and order types. For example, if there is a sudden surge in volume at a certain price level, it may indicate strong buying or selling pressure, creating a potential breakout or breakdown opportunity. Alternatively, if there is a large order imbalance between bids and asks at a certain price level, it may indicate an opportunity to trade in the direction of the imbalance.
- Enhancing risk management: By looking at Level 2 market data, traders can enhance their risk management by adjusting their entry and exit points, stop-loss orders, and position sizes according to the market conditions. For example, if there is low liquidity or high volatility in the market
These two different levels are available within the DAS Trader platform, with in-depth guides showcased on our YouTube page highlighting exactly what is needed to access, learn and utilize different functions within our software! If you have any questions or feel like you need that extra push to become a functioning trader, make sure to check out our YouTube channel for more details: https://www.youtube.com/@DASTradertv/videos

