
Under the “QUOTES” option in the menu bar, select “Fundamental” to open the Fundamental window and enter a security symbol to view the associate fundamental data (e.g. Average Volume, Highest/Lowest Price, Float data, Beta value, etc).
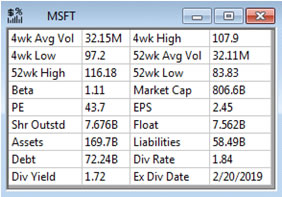
Fields on Fundamental window are explained below:
- 4wk Avg Vol: 4 Week Average Volume. This field displays the average daily volume in the last 4 weeks.
- 4wk High: 4 Week High. This field displays the highest price in the last 4 weeks.
- 4wk Low: 4 Weeks Low. This field displays the lowest price in the last 4 weeks.
- 52wk Avg Vol: 52 Weeks Average Volume. This field displays the average daily volume in the last 52 weeks.
- 52wk High: 52 Weeks High. This field displays the highest price in the last 52 weeks.
- 52wk Low: 52 Weeks Low. This field displays the lowest price in the last 52 weeks.
- Beta: This field measures volatility by comparing the covariance of a stock with the rest of the market.
- Market Cap: This field displays the market capitalization.
- PE: Price to Earnings ratio.
- EPS: Earnings Per Share. This field displays the portion of a company’s profit allocated to each outstanding share.
- Shr Outstd: Shares Outstanding. This field displays the amount of common shares outstanding.
- Float: This field displays the number of shares that are available for trading in the stock.
- Assets: This field displays the amount of total current assets.
- Liabilities: This field displays the amount of total current liabilities.
- Debt: This field displays the amount of long term debt.
- Div Rate: Dividend Rate. This field displays the annualized amount at which a dividend is paid.
- Div Yield: Dividend Yield. This field displays the annual dividends per share divided by the market price as a percentage.
- Ex Div Date: Ex-Dividend Date. This field displays the date in which a stock goes ex-dividend.
(Note: Previous closing price is used in fields that require “price” in the calculation.)


